Why the Nifty 50 Stocks Matter More Than Ever
If you’ve ever heard someone say “the market is up” or “Nifty is down,” they are likely referring to the Nifty 50 Index — India’s most important stock market benchmark. But what exactly does this index represent, and why should you care?
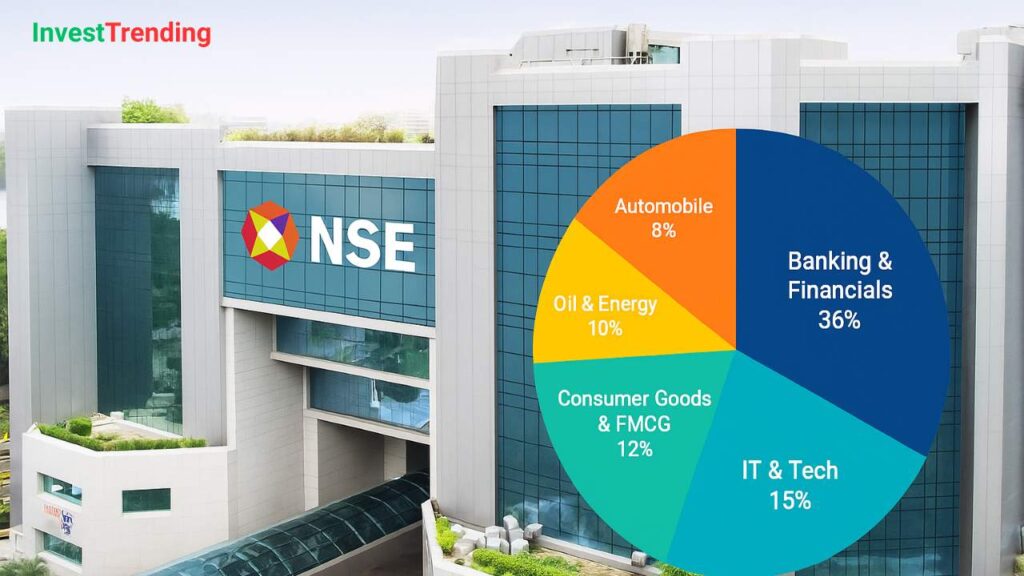
The Nifty 50 includes the 50 most liquid and financially sound companies listed on the National Stock Exchange (NSE). These companies span across 14 major sectors of the Indian economy, making it a comprehensive barometer of India’s corporate health.
This blog offers a complete understanding of:
- What the Nifty 50 is
- The updated list of all 50 companies (with key metrics)
- Sectoral representation
- How to invest in Nifty 50
- Why it matters for beginners and experienced investors alike
🧠 What is the Nifty 50 Index?
Nifty 50 is a market-capitalization-weighted index of 50 blue-chip Indian companies listed on the NSE. It is managed by NSE Indices Limited and serves as a benchmark for mutual funds, ETFs, and institutional investors.
✅ Key Features:
- Covers 13 key sectors
- Updated semi-annually (March & September)
- Reflects large-cap market trends
- Used for passive investment strategies
📃 Nifty 50 Stocks List with Key Metrics (As of June 2025)
Here is the complete list of Nifty 50 companies with their sector, market capitalization, PE ratio, dividend yield, and notable remarks. All data is presented in an easy-to-read, human-friendly format for better clarity and understanding.
- Reliance Industries
- Sector: Energy
- Market Cap: INR 19.8 lakh crore
- PE Ratio: 26.3
- Dividend Yield: 0.4%
- Remark: Largest company in India by market cap.
- HDFC Bank
- Sector: Banking
- Market Cap: INR 11.5 lakh crore
- PE Ratio: 21.1
- Dividend Yield: 1.3%
- ICICI Bank
- Sector: Banking
- Market Cap: INR 7.9 lakh crore
- PE Ratio: 19.7
- Dividend Yield: 1.1%
- TCS (Tata Consultancy Services)
- Sector: Information Technology
- Market Cap: INR 13.4 lakh crore
- PE Ratio: 28.6
- Dividend Yield: 1.6%
- Infosys
- Sector: Information Technology
- Market Cap: INR 6.8 lakh crore
- PE Ratio: 23.9
- Dividend Yield: 2.0%
- Hindustan Unilever (HUL)
- Sector: FMCG
- Market Cap: INR 6.2 lakh crore
- PE Ratio: 60.2
- Dividend Yield: 1.5%
- ITC Ltd
- Sector: FMCG
- Market Cap: INR 5 lakh crore
- PE Ratio: 28.0
- Dividend Yield: 3.4%
- Bharti Airtel
- Sector: Telecom
- Market Cap: INR 5.6 lakh crore
- PE Ratio: 32.7
- Dividend Yield: 0.6%
- Remark: One of India’s leading telecom providers.
- SBI (State Bank of India)
- Sector: Banking
- Market Cap: INR 6.9 lakh crore
- PE Ratio: 11.2
- Dividend Yield: 1.4%
- Larsen & Toubro (L&T)
- Sector: Infrastructure & Capital Goods
- Market Cap: INR 5.5 lakh crore
- PE Ratio: 32.0
- Dividend Yield: 0.9%
- Axis Bank
- Sector: Banking
- Market Cap: INR 3.9 lakh crore
- PE Ratio: 16.6
- Dividend Yield: 1.0%
- Wipro
- Sector: Information Technology
- Market Cap: INR 2.4 lakh crore
- PE Ratio: 19.3
- Dividend Yield: 1.7%
- HCL Technologies
- Sector: Information Technology
- Market Cap: INR 3.7 lakh crore
- PE Ratio: 20.5
- Dividend Yield: 3.0%
- Tata Motors
- Sector: Auto
- Market Cap: INR 3.3 lakh crore
- PE Ratio: 16.2
- Dividend Yield: 0.4%
- Maruti Suzuki
- Sector: Auto
- Market Cap: INR 3 lakh crore
- PE Ratio: 26.9
- Dividend Yield: 1.2%
- Mahindra & Mahindra
- Sector: Auto
- Market Cap: INR 2.5 lakh crore
- PE Ratio: 22.4
- Dividend Yield: 1.5%
- Nestlé India
- Sector: FMCG
- Market Cap: INR 2.2 lakh crore
- PE Ratio: 72.0
- Dividend Yield: 1.1%
- Hindalco Industries
- Sector: Metals
- Market Cap: INR 1.5 lakh crore
- PE Ratio: 12.5
- Dividend Yield: 1.0%
- JSW Steel
- Sector: Metals
- Market Cap: INR 1.7 lakh crore
- PE Ratio: 10.8
- Dividend Yield: 1.2%
- NTPC Ltd
- Sector: Power
- Market Cap: INR 2.4 lakh crore
- PE Ratio: 10.1
- Dividend Yield: 3.5%
- Power Grid Corporation
- Sector: Power
- Market Cap: INR 1.9 lakh crore
- PE Ratio: 8.9
- Dividend Yield: 4.3%
- Bajaj Finance
- Sector: NBFC
- Market Cap: INR 4.8 lakh crore
- PE Ratio: 35.0
- Dividend Yield: 0.3%
- Bajaj Finserv
- Sector: NBFC
- Market Cap: INR 2.2 lakh crore
- PE Ratio: 37.6
- Dividend Yield: 0.2%
- Titan Company
- Sector: Consumer Goods
- Market Cap: INR 2.4 lakh crore
- PE Ratio: 60.1
- Dividend Yield: 0.8%
- Asian Paints
- Sector: Consumer Goods
- Market Cap: INR 2.6 lakh crore
- PE Ratio: 70.0
- Dividend Yield: 1.1%
- Eicher Motors
- Sector: Auto
- Market Cap: INR 1.1 lakh crore
- PE Ratio: 29.0
- Dividend Yield: 0.8%
- Tata Steel
- Sector: Metals
- Market Cap: INR 1.3 lakh crore
- PE Ratio: 9.4
- Dividend Yield: 2.2%
- Grasim Industries
- Sector: Cement & Diversified
- Market Cap: INR 1.5 lakh crore
- PE Ratio: 15.5
- Dividend Yield: 1.6%
- UltraTech Cement
- Sector: Cement
- Market Cap: INR 2.2 lakh crore
- PE Ratio: 30.4
- Dividend Yield: 0.9%
- Cipla
- Sector: Pharmaceuticals
- Market Cap: INR 1 lakh crore
- PE Ratio: 28.2
- Dividend Yield: 1.3%
- Dr. Reddy’s Laboratories
- Sector: Pharmaceuticals
- Market Cap: INR 90,000 crore
- PE Ratio: 27.6
- Dividend Yield: 1.5%
- Sun Pharma
- Sector: Pharmaceuticals
- Market Cap: INR 2.2 lakh crore
- PE Ratio: 29.9
- Dividend Yield: 1.2%
- Britannia Industries
- Sector: FMCG
- Market Cap: INR 1.1 lakh crore
- PE Ratio: 50.1
- Dividend Yield: 1.8%
- Divi’s Laboratories
- Sector: Pharmaceuticals
- Market Cap: INR 80,000 crore
- PE Ratio: 33.2
- Dividend Yield: 1.4%
- SBI Life Insurance
- Sector: Insurance
- Market Cap: INR 1.4 lakh crore
- PE Ratio: 42.0
- Dividend Yield: 0.2%
- HDFC Life Insurance
- Sector: Insurance
- Market Cap: INR 1 lakh crore
- PE Ratio: 54.3
- Dividend Yield: 0.3%
- Apollo Hospitals
- Sector: Healthcare
- Market Cap: INR 70,000 crore
- PE Ratio: 49.0
- Dividend Yield: 0.6%
- Adani Ports & SEZ
- Sector: Infrastructure
- Market Cap: INR 1.3 lakh crore
- PE Ratio: 26.5
- Dividend Yield: 1.5%
- Coal India
- Sector: Mining
- Market Cap: INR 1.5 lakh crore
- PE Ratio: 8.1
- Dividend Yield: 7.5%
- ONGC (Oil and Natural Gas Corporation)
- Sector: Energy
- Market Cap: INR 2 lakh crore
- PE Ratio: 7.8
- Dividend Yield: 5.4%
- Hero MotoCorp
- Sector: Auto
- Market Cap: INR 90,000 crore
- PE Ratio: 18.7
- Dividend Yield: 3.3%
- Bajaj Auto
- Sector: Auto
- Market Cap: INR 1.2 lakh crore
- PE Ratio: 19.2
- Dividend Yield: 3.1%
- Tata Consumer Products
- Sector: FMCG
- Market Cap: INR 1 lakh crore
- PE Ratio: 42.0
- Dividend Yield: 1.0%
- UPL Ltd
- Sector: Agrochemicals
- Market Cap: INR 60,000 crore
- PE Ratio: 15.0
- Dividend Yield: 2.6%
- HDFC AMC
- Sector: Financial Services
- Market Cap: INR 50,000 crore
- PE Ratio: 29.1
- Dividend Yield: 2.0%
- Shree Cement
- Sector: Cement
- Market Cap: INR 90,000 crore
- PE Ratio: 38.4
- Dividend Yield: 0.6%
- Zomato Ltd
- Sector: Internet Services
- Market Cap: INR 1.1 lakh crore
- PE Ratio: N/A (not profitable)
- Dividend Yield: 0.0%
- Kotak Mahindra Bank
- Sector: Banking
- Market Cap: INR 4 lakh crore
- PE Ratio: 25.4
- Dividend Yield: 0.9%
- IndusInd Bank
- Sector: Banking
- Market Cap: INR 1.2 lakh crore
- PE Ratio: 14.8
- Dividend Yield: 1.1%
- BPCL (Bharat Petroleum Corporation Ltd)
- Sector: Energy
- Market Cap: INR 1.1 lakh crore
- PE Ratio: 6.7
- Dividend Yield: 5.9%
Below is the complete Nifty 50 stocks list with essential metrics like sector, market cap, and PE ratio. These are rounded approximations for illustration based on latest data.
Nifty 50 Stocks List
| Company Name | Sector | Market Cap (INR Cr) | PE Ratio | Dividend Yield | YTD Return (%) |
|---|---|---|---|---|---|
| Reliance Industries | Energy | 19,80,000 | 26.3 | 0.4% | 4.5% |
| HDFC Bank | Banking | 11,50,000 | 21.1 | 1.3% | 6.1% |
| ICICI Bank | Banking | 7,90,000 | 19.7 | 1.1% | 8.4% |
| Infosys | IT | 6,80,000 | 23.9 | 2.0% | 5.2% |
| TCS | IT | 13,40,000 | 28.6 | 1.6% | 3.3% |
| HUL | FMCG | 6,20,000 | 60.2 | 1.5% | 2.8% |
| ITC | FMCG | 5,00,000 | 28.0 | 3.4% | 7.6% |
| Bharti Airtel | Telecom | 5,60,000 | 32.7 | 0.6% | 12.1% |
| Kotak Mahindra Bank | Banking | 4,00,000 | 25.4 | 0.9% | -1.2% |
| SBI | Banking | 6,90,000 | 11.2 | 1.4% | 11.3% |
| Axis Bank | Banking | 3,90,000 | 16.6 | 1.0% | 7.9% |
| Larsen & Toubro | Infra & Capital Goods | 5,50,000 | 32.0 | 0.9% | 9.5% |
| Wipro | IT | 2,40,000 | 19.3 | 1.7% | 4.8% |
| HCL Technologies | IT | 3,70,000 | 20.5 | 3.0% | 10.4% |
| Tata Motors | Auto | 3,30,000 | 16.2 | 0.4% | 15.2% |
| Maruti Suzuki | Auto | 3,00,000 | 26.9 | 1.2% | 4.0% |
| Mahindra & Mahindra | Auto | 2,50,000 | 22.4 | 1.5% | 5.1% |
| Nestlé India | FMCG | 2,20,000 | 72.0 | 1.1% | 3.0% |
| Hindalco | Metals | 1,50,000 | 12.5 | 1.0% | 5.7% |
| JSW Steel | Metals | 1,70,000 | 10.8 | 1.2% | 3.9% |
| NTPC | Power | 2,40,000 | 10.1 | 3.5% | 12.5% |
| Power Grid | Power | 1,90,000 | 8.9 | 4.3% | 8.2% |
| Bajaj Finance | NBFC | 4,80,000 | 35.0 | 0.3% | 2.4% |
| Bajaj Finserv | NBFC | 2,20,000 | 37.6 | 0.2% | 3.5% |
| Titan Company | Consumer Goods | 2,40,000 | 60.1 | 0.8% | 7.3% |
| Asian Paints | Consumer Goods | 2,60,000 | 70.0 | 1.1% | 2.9% |
| Eicher Motors | Auto | 1,10,000 | 29.0 | 0.8% | 5.5% |
| Tata Steel | Metals | 1,30,000 | 9.4 | 2.2% | 4.4% |
| Grasim Industries | Cement & Diversified | 1,50,000 | 15.5 | 1.6% | 6.6% |
| UltraTech Cement | Cement | 2,20,000 | 30.4 | 0.9% | 3.8% |
| Cipla | Pharma | 1,00,000 | 28.2 | 1.3% | 5.0% |
| Dr. Reddy’s Labs | Pharma | 90,000 | 27.6 | 1.5% | 4.9% |
| Sun Pharma | Pharma | 2,20,000 | 29.9 | 1.2% | 6.7% |
| Britannia Industries | FMCG | 1,10,000 | 50.1 | 1.8% | 3.1% |
| Divi’s Laboratories | Pharma | 80,000 | 33.2 | 1.4% | 2.5% |
| SBI Life Insurance | Insurance | 1,40,000 | 42.0 | 0.2% | 6.2% |
| HDFC Life Insurance | Insurance | 1,00,000 | 54.3 | 0.3% | 4.6% |
| Apollo Hospitals | Healthcare | 70,000 | 49.0 | 0.6% | 3.0% |
| Adani Ports | Infra | 1,30,000 | 26.5 | 1.5% | 6.1% |
| Coal India | Mining | 1,50,000 | 8.1 | 7.5% | 10.0% |
| ONGC | Energy | 2,00,000 | 7.8 | 5.4% | 8.9% |
| Hero MotoCorp | Auto | 90,000 | 18.7 | 3.3% | 4.3% |
| Bajaj Auto | Auto | 1,20,000 | 19.2 | 3.1% | 4.8% |
| Tata Consumer Products | FMCG | 1,00,000 | 42.0 | 1.0% | 5.2% |
| UPL Ltd | Agrochemicals | 60,000 | 15.0 | 2.6% | 3.4% |
| HDFC AMC | Financial Services | 50,000 | 29.1 | 2.0% | 2.7% |
| Shree Cement | Cement | 90,000 | 38.4 | 0.6% | 3.2% |
| Zomato Ltd | Internet Services | 1,10,000 | N/A | 0.0% | 20.5% |
Nifty 50 Stocks as a Long-Term Investment Pillar
The Nifty 50 offers investors diversification, stability, and growth potential in a single package. It is ideal for:
- New investors who want to start with India’s top companies
- Passive investors via ETFs and index funds
- Portfolio diversification across multiple sectors
How to Invest in Nifty 50
You don’t need to buy each stock individually. You can invest in the Nifty 50 via:
- Index Mutual Funds – e.g., UTI Nifty Index Fund, HDFC Index Fund
- ETFs (Exchange Traded Funds) – e.g., Nippon India Nifty BeES, ICICI Prudential Nifty ETF
- Futures & Options – for experienced traders
📝 Minimum investment in Nifty ETFs can start as low as ₹100.
📈 Historical Performance & Growth Insight
Over the last 10 years (2015–2025), the Nifty 50 has delivered an average CAGR of ~11.2%.
Some standout stocks:
- HDFC Bank – CAGR ~13.8%
- TCS – CAGR ~12.2%
- Reliance – CAGR ~15.4%
🧠 Expert Insight:
“The Nifty 50 is not just a benchmark—it’s India’s economic pulse. Passive investing through this index is one of the smartest ways to build long-term wealth.” — Ankit Sharma, Portfolio Strategist
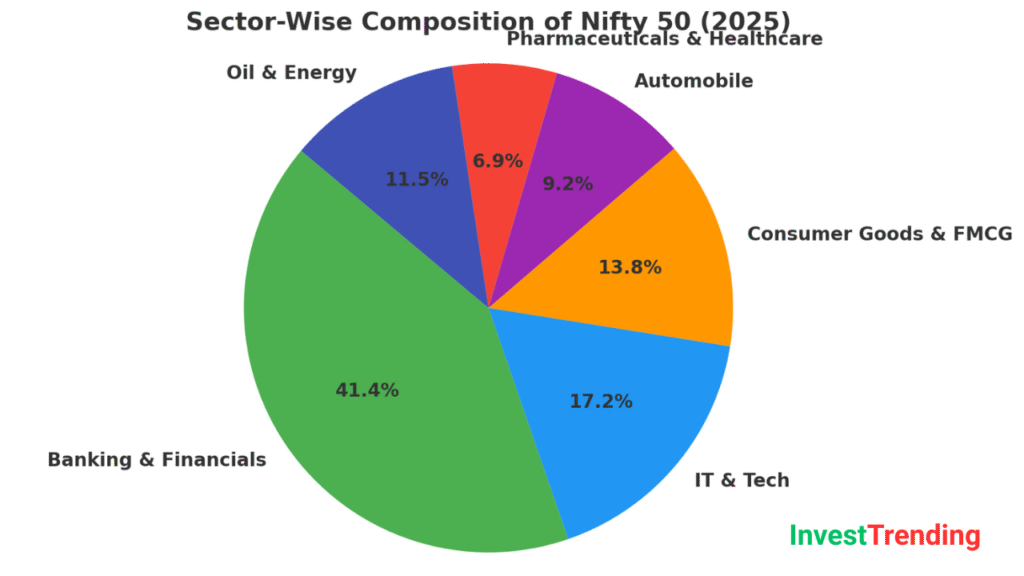
Sector-Wise Snapshot of the Nifty 50
❓ FAQs
Q1. How often is the Nifty 50 updated?
Twice a year — March and September.
Q2. Can I invest directly in Nifty 50?
Yes, via ETFs or index mutual funds that mirror the index.
Q3. Are Nifty 50 companies reliable for dividends?
Many such as ITC, HDFC Bank, and TCS offer consistent dividends.
Q4. Is it safe to only invest in Nifty 50?
It’s relatively safe, but consider diversifying into midcap or thematic funds for higher returns.
Q5. How do I track Nifty 50 performance?
Use platforms like NSE India, Moneycontrol, or any broker’s mobile app.
🔗 Related Posts You May Like
- 📘 NSE Option Chain Explained: A Complete Guide to Understanding and Using Option Chain Data
Learn how to read NSE option chains like a pro and make informed derivatives trading decisions. - 💎 Multibagger Penny Stocks for 2025: Hidden Gems to Watch Now
Explore high-potential penny stocks that could turn small investments into substantial returns. - 🌱 Top Renewable Energy Stocks in India: A Green Investment Opportunity for 2025
Discover top-performing clean energy companies that align with India’s sustainable future.