In the fast-paced world of trading, every second matters. But sometimes, measuring trades by time alone doesn’t give the full picture. Enter the Trading Tick — a powerful concept that allows traders to see market movements based on the number of trades rather than just time passing. Understanding trading ticks can open new doors for scalping, day trading, and even swing trading strategies.
In this article, we’ll explain what a trading tick is, why it matters, how it compares to time charts, and how you can leverage it in your trading strategy.
What is a Trading Tick?
A trading tick refers to the smallest possible movement in the price of a security. It can either be an increase or decrease. In the context of a tick chart, a new bar is created after a specific number of trades have occurred, regardless of how much time has passed.
Simple Definition:
A tick represents a single transaction between buyers and sellers.
If you set a tick chart to 200 ticks, a new candlestick will form after every 200 trades, no matter if it takes 2 minutes or 20 seconds.
Importance of Trading Ticks
Why should traders care about ticks?
| Reason | Explanation |
|---|---|
| Profit and Loss Calculation | Gains or losses are often calculated per tick. |
| Order Execution | Some orders trigger based on tick changes. |
| Market Sentiment | Frequent tick changes reveal market activity trends. |
| Trading Strategy | Tick analysis can guide short-term trading strategies. |
Mastering ticks helps traders optimize entries, exits, and risk management.
Tick Size vs. Tick Value
- Tick Size: The minimum price change allowed in a market.
- Tick Value: The amount of money a trader gains or loses when the price moves by one tick.
Example:
- If the tick size is $0.25 and each tick is worth $12.50 per contract, then a move from 100.00 to 100.25 would mean a profit or loss of $12.50 depending on the trade direction.
Types of Ticks
- Up Tick
- Occurs when the latest price is higher than the previous one.
- Down Tick
- Happens when the latest price is lower than the previous one.
- Zero-Plus Tick
- The trade price is the same as the previous, but the last tick was upward.
- Zero-Minus Tick
- The trade price is the same as the previous, but the last tick was downward.
These ticks give insight into the momentum and strength of buyers and sellers.
How Tick Charts Work
Most traders are familiar with time-based charts (like 1-minute or 5-minute charts). But tick charts work differently. Instead of plotting a candle every minute, a tick chart creates a new bar after a set number of trades.
Example:
- A 100-tick chart plots a new candle after every 100 trades, no matter how long it takes.
Benefits of Tick Charts:
- More Detail: In fast-moving markets, tick charts show more price action.
- Customizable: Traders can choose 50-tick, 100-tick, or even 1000-tick charts.
- Clearer Trends: Sometimes tick charts show trends more clearly than time charts.
Tick Data and High-Frequency Trading (HFT)
In the world of High-Frequency Trading, ticks are gold. HFT firms analyze tick-by-tick data to find patterns, arbitrage opportunities, or micro-trends invisible on regular charts.
Interesting Fact:
High-frequency traders can execute thousands of trades in a single second based on tick movements!
However, for everyday retail traders, using tick data smartly can still significantly improve short-term trading performance.
How to Use Tick Information in Your Trading Strategy
Here are practical ways traders use ticks:
- Entry and Exit Points
- Watch tick movement to refine your trade entries and exits.
- Trend Confirmation
- A series of upticks can confirm an uptrend; downticks can confirm a downtrend.
- Volume Analysis
- Combine tick and volume data for powerful insights into supply and demand.
- Scalping Strategies
- In scalping (very short-term trading), tick charts provide the necessary precision.
- Stop Loss Setting
- Knowing average tick movement helps set smarter stop-loss levels.
Tips for Beginners
- Start with Time Charts: Before diving into tick charts, build your skills on 5-min or 15-min time frames.
- Use Demo Accounts: Practice analyzing tick movements without risking real money.
- Avoid Overtrading: Ticks change constantly. Don’t let every minor move trigger an emotional reaction.
- Choose the Right Market: Futures and forex markets are ideal for tick-based strategies due to their liquidity.
- Stay Calm: Remember, not every tick matters — focus on the broader trend.
How Tick Charts Work
Instead of focusing on time intervals (like 1-minute or 5-minute charts), tick charts focus on trading activity.
- High Activity: More candles will form quickly.
- Low Activity: Candles form more slowly.
This way, tick charts give a real-time visual of market momentum, making it easier to spot trends and reversals.
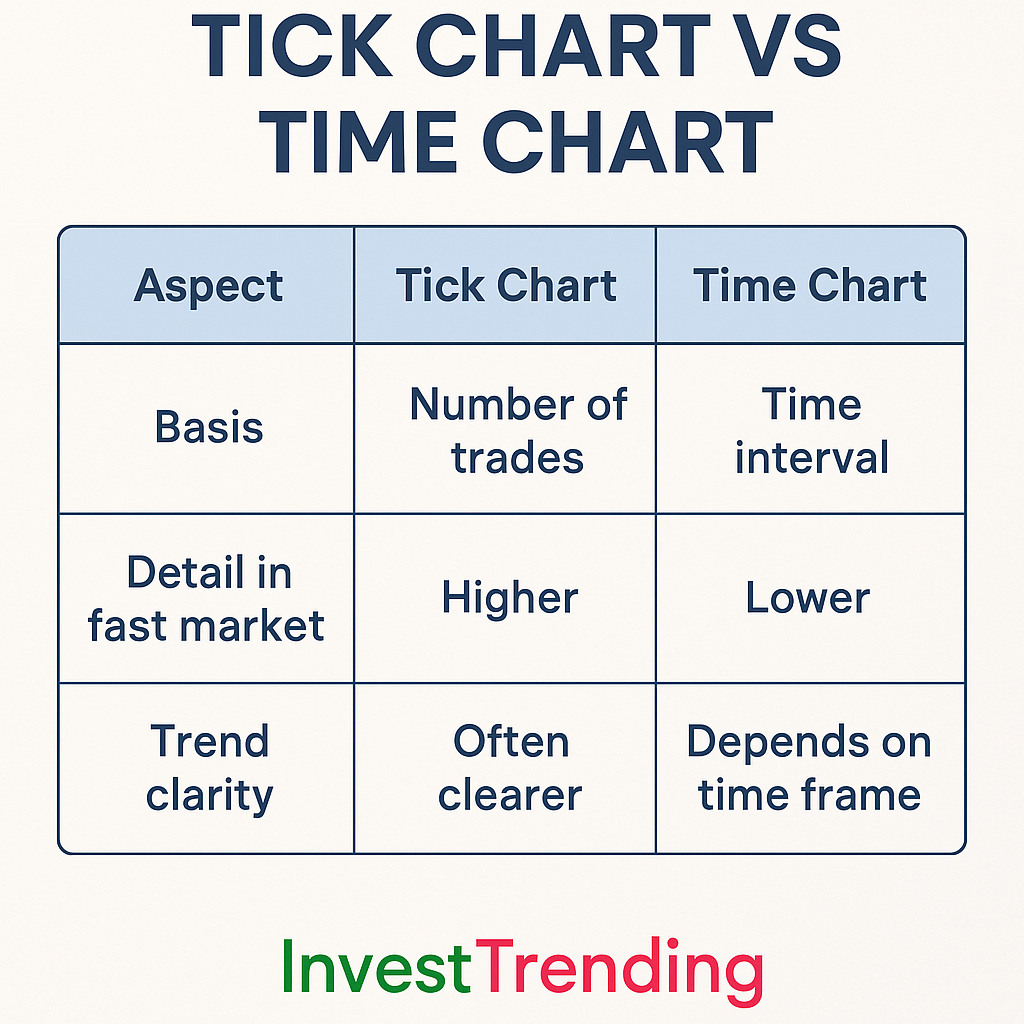
Tick Chart vs Time Chart
To understand better, here’s a comparison table:
| Aspect | Tick Chart | Time Chart |
|---|---|---|
| Basis | Number of trades | Time interval |
| Detail in fast market | Higher | Lower |
| Trend clarity | Often clearer | Depends on time frame |
| Noise | Reduced | Sometimes high |
| Adaptability | High | Low |
Tick Chart vs Time Chart
Why Traders Prefer Tick Charts
- Clearer Trends: Less noise, more true price action.
- More Trade Opportunities: Especially during high volatility sessions.
- Better Scalping: Scalpers can time entries and exits precisely.
- Market Pulse: Get a real sense of “how active” the market is.
Example:
Imagine trading a stock during earnings season. A time-based chart may show flat candles because time keeps moving even if trading is low. A tick chart, however, shows the action precisely as it happens.
Key Advantages of Tick Charts
1. Flexibility
Tick charts adjust naturally to market activity. You see more data when volatility is high and fewer distractions during quiet periods.
2. Speed
Fast-moving markets mean faster candle formation. Traders can make quicker decisions based on real data.
3. Noise Reduction
Since a candle only forms after a set number of trades, minor price fluctuations without real interest are filtered out.
4. Enhanced Technical Analysis
Many traders use indicators like Moving Averages, RSI, MACD, and Bollinger Bands on tick charts to capture more accurate signals.
5. Better Market Timing
Tick charts can help traders time entries and exits with greater precision compared to time-based charts, leading to better risk management.
How to Set Up a Tick Chart
Setting up a tick chart depends on your trading platform (like MetaTrader, NinjaTrader, or ThinkorSwim). Generally, you:
- Open a chart.
- Select “Tick” as the type instead of “Time”.
- Choose the number of ticks (e.g., 100 ticks, 200 ticks, etc.).
Pro Tip:
For volatile stocks or forex pairs, lower tick numbers (like 50-100) work better. For stable instruments, higher tick numbers (like 300-500) are ideal.
Common Mistakes to Avoid
- Overtrading: Tick charts move fast. Don’t rush decisions without proper analysis.
- Ignoring Volume: Always combine tick data with volume and order flow analysis for better decision-making.
- Poor Tick Settings: Setting tick counts too low or too high can distort trends and mislead analysis.
- Neglecting Risk Management: Fast movement can lead to emotional decisions. Always stick to your stop-loss and position sizing rules.
When to Use Tick Charts
| Scenario | Best Practice |
| Fast-moving news market | Use lower tick numbers for clarity |
| Scalping | 50-100 ticks for quick trades |
| Day Trading | 200-300 ticks to capture strong trends |
| Swing Trading | Prefer time charts unless high activity |
| High Volatility Events | Tick charts capture rapid shifts |
| Trading Futures | Ideal for commodities and indices |
Best Trading Strategies with Tick Charts
- Breakout Trading: Identify rapid breakouts above resistance or below support.
- Pullback Entries: Enter trades after minor corrections in an ongoing trend.
- Trend Following: Use moving averages to ride longer trends on active markets.
- Scalp Reversals: Take quick profits when momentum shows exhaustion.
Tick Charts in Different Markets
Tick charts behave uniquely across different asset classes because of variations in liquidity, volatility, and trading hours.
- Stocks:
Highly liquid stocks like Apple (AAPL) or Microsoft (MSFT) generate a rapid series of tick candles during active market hours (especially near opening and closing bells). This high tick volume allows traders to capture micro-trends and breakout movements quickly. - Forex:
In the 24-hour forex market, tick activity varies according to global trading sessions. Tick charts show more activity during overlapping sessions like London-New York. For example, EUR/USD ticks spike between 1 PM to 4 PM GMT. - Futures:
Futures contracts (e.g., S&P 500 E-mini) often see large bursts of tick activity during economic news releases, market opens, or expiration dates. Tick charts help traders ride the momentum efficiently during these volatile periods.
Pro Tip:
Always adjust your tick size based on market liquidity and volatility to optimize your analysis.
Combining Tick Charts with Other Tools
Tick charts become even more powerful when combined with other analytical tools:
- Volume Analysis:
Confirm if price movements are backed by real trading volume. A breakout accompanied by heavy tick volume is more reliable than one with low volume. - Order Flow Analysis:
Order flow tools allow you to view buy/sell pressure in real time. When used with tick charts, it helps spot real intentions behind price moves, preventing false breakouts. - Moving Averages on Tick Charts:
Use short-term (e.g., 9 EMA) and long-term (e.g., 50 EMA) moving averages directly on tick charts to define trend direction and pullback opportunities.
Historical Data on Tick Charts
Many traders wonder if they can backtest strategies using tick charts.
Yes, you can — but it requires historical tick data, which some platforms (like NinjaTrader, TradeStation, or CQG) provide.
- Backtesting Tick Data:
Replays real market activity tick-by-tick. Ideal for testing scalping and high-frequency trading strategies where timing is critical. - Caution:
Tick data storage is massive compared to regular OHLC (Open-High-Low-Close) data. Make sure your system can handle it.
Tick Chart Data vs Regular Candlestick Chart Data
- Regular Candlestick Charts are based on time — they create candles even when trading activity is low.
- Tick Charts, on the other hand, only create candles when real transactions happen, revealing true momentum.
High-Frequency Traders (HFT) prefer tick charts because they cut through time-based “dead zones” and show price action driven purely by trading activity.
Example:
A time chart might show a quiet, flat candle, while a tick chart during the same period might reveal small but consistent buying pressure that eventually leads to a breakout.
Risk Management with Tick Charts
Tick charts can significantly improve your risk management approach:
- Tighter Stop-Loss:
Since tick charts show real-time activity, you can place stop-loss orders closer to technical levels without unnecessary wiggle room. - Better Profit Targeting:
Monitor momentum closely to maximize profits and exit trades before a reversal begins. - Adjusting Position Size:
If you notice rapid tick movements, you can scale down your trade size to protect your capital.
Golden Rule:
Always combine tick chart entries with clear stop-loss and position-sizing rules. Volatility can be your best friend — or worst enemy — if unmanaged.
Conclusion: Why Ticks Matter
A trading tick isn’t just a tiny market move — it’s a powerful tool for modern traders. By understanding and using tick charts, you can:
- Read the market’s heartbeat in real-time.
- React faster and smarter.
- Gain an edge over traders who only use time-based charts.
- Improve your technical analysis and timing.
- Manage risk better by understanding trade volume dynamics.
Whether you are a scalper looking for quick profits or a day trader wanting more precise entries, tick charts could transform your trading experience.
Stay ahead. Stay InvestTrending!
About InvestTrending:
InvestTrending is dedicated to empowering traders and investors with professional-grade knowledge, strategies, and tools. Join our community and trade smarter every day!yes
FAQs
Q1. What is a good tick setting for day trading? A setting between 200 to 300 ticks works well for most active markets.
Q2. Are tick charts better than time charts? It depends on your trading style. For faster, action-based trading, tick charts offer a big advantage.
Q3. Can beginners use tick charts? Yes, but start with higher tick counts to avoid information overload.
Q4. Which platforms offer tick charts? Popular platforms like MetaTrader, NinjaTrader, and ThinkorSwim offer tick chart options.
Q5. How do I decide my tick size? Test different settings during live or paper trading and adjust based on asset volatility and trading style.
Q6: Can I trade only based on ticks? Yes, many scalpers and day traders use tick-based strategies, but it’s important to combine with good risk management.
Q7: What is a “tick size” in futures trading? It’s the minimum allowed price movement for a futures contract.
Q8: Is tick trading good for beginners? It can be challenging due to the fast pace. Beginners should first master basic trading skills.
Q9: How many ticks are in 1 point? Depends on the market. For example, in S&P 500 futures, 1 point = 4 ticks.
Conclusion
Understanding trading ticks is like learning the language of the market’s heartbeat. Every tick tells a story — about traders’ emotions, market strength, and future direction. While mastering tick-based trading can be a bit advanced, having even a basic understanding can significantly sharpen your trading edge.
If you’re a beginner, take it slow. Practice, observe, and build your trading skills step-by-step. With time and patience, you’ll find that paying attention to ticks can make a big difference in your trading success.
Stay tuned for more insightful guides on trading. Happy Trading!