Introduction
Bajaj Finance Limited is one of India’s leading non-banking financial companies (NBFCs), offering a range of financial services like consumer lending, SME loans, and commercial lending. It has shown remarkable growth over the years, making its stock a favorite among investors. This blog covers everything you need to know about Bajaj Finance’s share price in a simple and professional format.
Live Share Price Summary (as of April 7, 2025)
| Attribute | Value |
|---|---|
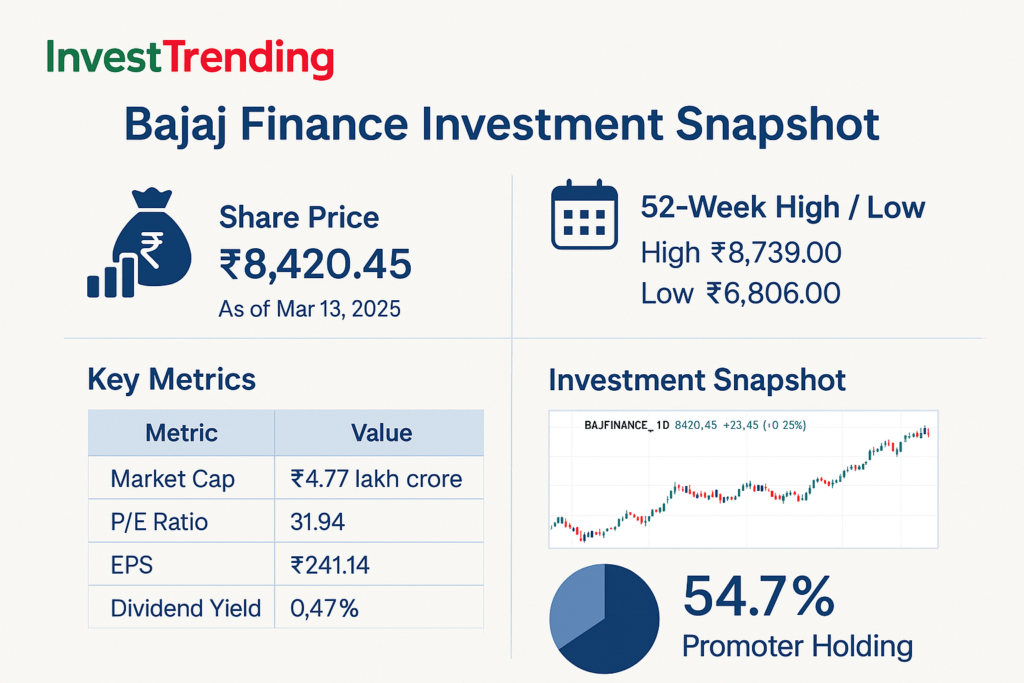
| Current Price | ₹8,420.45 |
| Change Today | +₹63.50 |
| Percentage Change | +0.76% |
| Market Trend | Bullish |
| NSE Code | BAJFINANCE |
| BSE Code | 500034 |
| Day’s High / Low | ₹8,492 / ₹8,360 |
| Volume Traded | 12.8 lakh shares |
Bajaj Finance is currently witnessing bullish momentum in the market, showing positive movement with moderate intraday fluctuation.
Historical Share Price Performance
| Year | Share Price (INR) |
| 1995 | 7.55 |
| 2009 | 95.00 |
| 2015 | 4,263.00 |
| 2020 | 3,000.00 |
| 2023 | 7,421.80 |
| 2025 | 8,420.45 |
Over the decades, Bajaj Finance has seen a tremendous appreciation in its stock value, particularly post-2009, marking its transformation into a major financial powerhouse.
Key Financial Metrics (As of Sept 30, 2024)
| Metric | Value |
| Market Capitalization | ₹4,76,813 crore |
| Price-to-Earnings (P/E) Ratio | 31.94 |
| Earnings Per Share (EPS) | ₹241.14 |
| Price-to-Book (P/B) Ratio | 6.26 |
| Dividend Yield | 0.47% |
| 52-Week High/Low | ₹8,739 / ₹6,806 |
These robust financial indicators reflect Bajaj Finance’s healthy profitability, investor confidence, and consistent earnings.
Historical Returns Comparison
| Period | Bajaj Finance | Nifty Financial Services |
| 1 Week | +1.8% | +0.9% |
| 1 Month | +4.3% | +3.2% |
| 6 Months | +11.5% | +7.9% |
| YTD (2025) | +6.2% | +4.5% |
| 1 Year | +23.4% | +13.1% |
Bajaj Finance has consistently outperformed its sector index, making it an attractive investment for both short-term and long-term holders.
Technical Analysis Summary
| Indicator | Value | Analysis |
| 50-Day Moving Average | ₹8,120.35 | Bullish |
| 200-Day Moving Average | ₹7,654.60 | Bullish |
| RSI (14-day) | 61.2 | Neutral/Bullish |
| Support Levels | ₹8,200, ₹8,050 | – |
| Resistance Levels | ₹8,500, ₹8,750 | – |
Technically, the stock is in a bullish phase supported by strong moving average positions and RSI trending towards positive momentum.
Fundamental Highlights
- Q2FY25 Net Profit: ₹3,550 crore (YoY growth of 28%)
- Revenue: ₹12,780 crore
- Net Interest Margin (NIM): 10.4%
- Gross NPA: 0.89%
- Management Outlook: Focused on expanding digital lending and cross-selling via Bajaj Wallet.
Bajaj Finance’s strong financial health, low NPAs, and focus on tech-driven growth make it a resilient and forward-looking company.
Shareholding Pattern (Sept 30, 2024)
| Shareholder Type | Percentage |
| Promoters | 54.7% |
| Foreign Portfolio Investors | 17.76% |
| Mutual Funds | 9.52% |
| Insurance Companies | 4.62% |
| Individual Investors | 7.36% |
| Others | 6.01% |
The significant promoter holding signals trust and long-term commitment, while increasing FPI participation reflects global investor confidence.
Peer Comparison (FY24)
| Company | P/E Ratio | EPS | Market Cap (Cr) | Dividend Yield |
| Bajaj Finance | 31.94 | ₹241.14 | ₹4,76,813 | 0.47% |
| HDFC Ltd. | 27.15 | ₹118.45 | ₹4,95,000 | 1.20% |
| Muthoot Finance | 14.25 | ₹85.60 | ₹58,000 | 1.80% |
Though slightly overvalued in comparison, Bajaj Finance justifies its P/E ratio with consistent returns and growth potential.
Recent News & Developments
- Dec 2024: Ended 8-year co-branded credit card partnership with RBL Bank.
- Jan 2025: Launched new digital EMI card & Bajaj Wallet with UPI features.
- Mar 2025: Investor Day highlights: focus on expanding into rural fintech services.
Recent developments emphasize a strategic pivot toward digitalization and rural market penetration.
Infographic: Bajaj Finance Ltd.
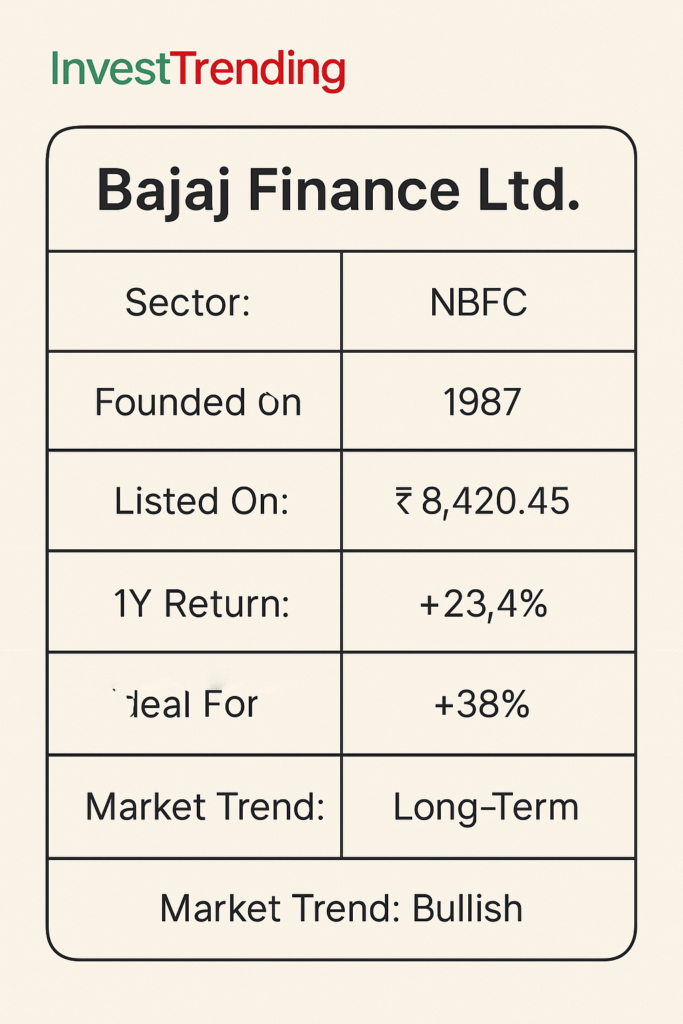
A quick glance at Bajaj Finance’s core details shows why it’s considered a reliable and rewarding pick for long-term investment.
TradingView Chart
Bajaj Finance Ltd. Live Share Chart
Note: If the chart doesn’t load correctly, please visit TradingView directly.
ESG and Risk Metrics
- ESG Score (2024): 67/100 (Refinitiv)
- Environmental Initiatives: Paperless onboarding, digital lending.
- Governance: Strong board independence and audit practices.
- Beta (Volatility): 1.2 (Moderate volatility)
- Debt-to-Equity Ratio: 4.3
- NPA Risk: Low (Gross NPA under 1%)
Bajaj Finance shows a balanced risk profile, progressive environmental focus, and sound corporate governance.
Upcoming Events & Investor Tools
- Q4 FY25 Results Announcement: May 15, 2025
- AGM Scheduled: July 2025
- Price Alert Tool: Coming soon on official app
- Return Calculator: Plan historical ROI from past investments
Stay informed and plan your investments with these upcoming tools and announcements.
Conclusion
Bajaj Finance has established itself as a high-performing NBFC backed by strong financials and consistent growth. With steady investor interest and innovative offerings, it remains a solid option for long-term portfolios. As always, investors should conduct their own research or consult a financial advisor before making investment decisions.
Disclaimer: Stock prices and market conditions are subject to change. This blog is for informational purposes only and does not constitute investment advice.