Candlestick Charts—Your First Step to Smarter Trading
If you’re stepping into the world of stock, crypto, or forex trading, understanding candlestick patterns is a game-changer. These small but mighty tools have been guiding traders for centuries—from Japanese rice merchants in the 1700s to modern-day Wall Street professionals.
This guide will walk you through what candlestick charts are, why they matter, and how to start spotting powerful trading signals from over 100 different candlestick patterns—all in simple language.
What Are Candlestick Charts?
Candlestick charts are a popular tool in technical analysis. Each candlestick tells a story of price action over a chosen time frame—whether that’s a minute, an hour, or a day.
Anatomy of a Candlestick:
- Open: Price at the beginning of the period
- Close: Price at the end of the period
- High: Maximum price during the period
- Low: Minimum price during the period
The “body” of the candle shows the difference between the open and close, while the “wicks” (or shadows) indicate the highest and lowest prices.
Color Coding:
- Bullish Candle (usually green or white): Close > Open
- Bearish Candle (usually red or black): Close < Open
“Candlesticks are like visual whispers from the market—telling you where buyers and sellers are headed.”
Why Are Candlestick Patterns Important in Trading?
Candlestick patterns are essential because they reveal the psychology of buyers and sellers. Unlike lagging indicators, candlestick patterns reflect real-time price sentiment.
Key Benefits:
- Spot early trend reversals and continuation signals
- Time your entry and exit more effectively
- Make more informed decisions without relying solely on indicators
Whether you’re day trading, swing trading, or investing long term, candlestick analysis gives you an edge.
Types of Candlestick Patterns: Reversal vs Continuation
Candlestick patterns generally fall into two major categories:
1. Reversal Patterns
These suggest a potential change in the existing trend. Example: A bullish reversal after a downtrend.
2. Continuation Patterns
These indicate the current trend is likely to continue. Example: A bullish continuation in an uptrend.
Both types are vital for timing your trades and managing risk.
Basic Single Candlestick Patterns (With Examples)
These patterns involve just one candle and are great for beginners.
| Pattern | Type | What It Means |
|---|---|---|
| Doji | Neutral | Indecision in the market |
| Hammer | Bullish Reversal | Price may rise after a downtrend |
| Hanging Man | Bearish Reversal | Price may fall after an uptrend |
| Shooting Star | Bearish Reversal | Warning of potential drop |
| Marubozu | Momentum | Strong buying/selling pressure |
| Spinning Top | Uncertainty | Weak movement in either direction |
| Dragonfly Doji | Bullish Reversal | Strong buy rejection at lows |
| Gravestone Doji | Bearish Reversal | Strong sell rejection at highs |
➡️ Pro Tip: When these patterns appear near support or resistance levels, they become much more reliable.
Double Candlestick Patterns: Buyer vs Seller Tug-of-War
Double candlestick patterns are powerful confirmation signals. They involve two candles interacting.
Common Double Patterns:
- Bullish Engulfing: Small red candle followed by a larger green one → Signals upward reversal
- Bearish Engulfing: Small green candle followed by a larger red one → Signals downward reversal
- Tweezer Top/Bottom: Matching highs/lows showing a potential reversal
- Harami (Bullish/Bearish): Small candle within a large candle’s body → Reversal signal with caution
- Piercing Line / Dark Cloud Cover: Mixed bullish and bearish signals depending on direction
Triple Candlestick Patterns: Strong Trend Indicators
These patterns offer some of the most dependable signals in technical analysis.
Key Triple Patterns:
- Morning Star: Bullish reversal with a 3-candle formation
- Evening Star: Bearish reversal pattern
- Three White Soldiers: Strong bullish signal
- Three Black Crows: Strong bearish signal
- Rising / Falling Three Methods: Continuation patterns confirming a trend
➡️ Case Insight: If you spot “Three White Soldiers” after a long downtrend, it’s often a strong reversal indicator—but confirm with volume and support levels.
Full List of 100+ Candlestick Patterns (Grouped)
Candlestick patterns are vital tools used in technical analysis to predict future price movements based on past price data. They reflect the emotions of traders and show whether bulls or bears are in control.
Below is a comprehensive list of over 100 candlestick patterns, categorized for clarity:
Single Candlestick Patterns

1. Doji
A Doji candlestick forms when the open and close prices are nearly identical, creating a cross or plus-sign shape. It signals indecision between buyers and sellers in the market. When spotted at the top or bottom of a trend, it may indicate a potential reversal — but traders should always confirm with volume or the next candle.
2. Hammer
A Hammer forms at the bottom of a downtrend and has a small body with a long lower shadow, showing that buyers pushed the price back up after strong selling pressure. It signals a potential bullish reversal. Traders often look for confirmation in the next candle before entering a trade.
3. Inverted Hammer
The Inverted Hammer appears at the bottom of a downtrend and has a small body with a long upper shadow and little or no lower shadow. It indicates potential bullish reversal, suggesting that buyers tried to push the price higher but faced resistance. If followed by a bullish candle, it strengthens the reversal signal.
4. Hanging Man
The Hanging Man is a bearish reversal pattern that typically appears after a strong uptrend. It has a small body near the top and a long lower shadow, signaling that selling pressure is starting to build. Traders watch for confirmation from the next candle before acting, as it indicates potential weakness in bullish momentum.
5. Shooting Star
The Shooting Star is a bearish reversal pattern that appears after an uptrend, characterized by a small body near the bottom and a long upper shadow. It indicates that buyers tried to push prices higher but sellers regained control by the end of the session. Traders often look for confirmation in the next candle before making decisions, as it signals a potential end to bullish momentum.
6. Spinning Top
The Spinning Top is a candlestick with a small body and long upper and lower shadows, indicating indecision in the market. Neither buyers nor sellers gain full control, and it often signals a potential pause or reversal in the current trend. Traders view it as a sign to wait for confirmation before making directional trades.
7. Marubozu
The Marubozu is a powerful candlestick with a full body and no shadows (wicks), indicating strong momentum in one direction. A Bullish Marubozu opens at the low and closes at the high, signaling strong buying pressure, while a Bearish Marubozu opens at the high and closes at the low, showing strong selling dominance. Traders interpret Marubozu as a sign of trend continuation or the beginning of a strong new trend.
8. Dragonfly Doji
The Dragonfly Doji is a single-candle pattern that forms when the open, high, and close are nearly the same, with a long lower shadow. It signals that sellers controlled most of the session but lost ground by the close, indicating potential bullish reversal if it appears after a downtrend. Traders should watch for confirmation in the next candle before acting.
9. Gravestone Doji
The Gravestone Doji features a long upper shadow with the open, low, and close prices all near the same level, resembling an inverted “T.” This pattern suggests that buyers pushed prices higher during the session but lost control by the close, signaling a possible bearish reversal after an uptrend. Traders often wait for confirmation from the following candle before making decisions.
10. Long-Legged Doji
The Long-Legged Doji has long upper and lower shadows with the open and close prices virtually equal, showing extreme indecision in the market. This pattern reflects a tug-of-war between buyers and sellers, often signaling a potential reversal or pause in the current trend. Traders look for confirmation from the next candlestick to determine the market’s next direction.
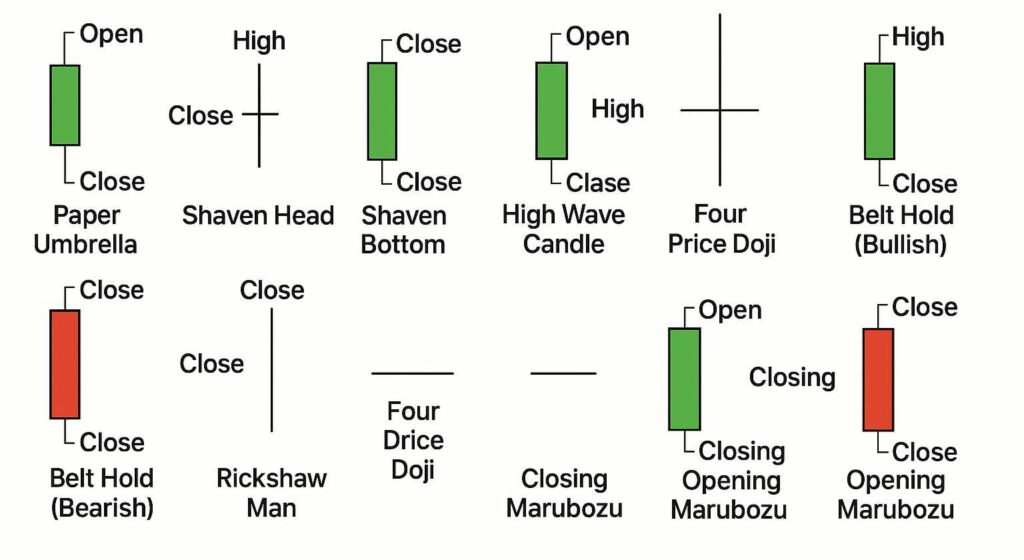
11. Paper Umbrella
The Paper Umbrella is a candlestick with a small real body near the top and a long lower shadow, resembling an umbrella shape. It indicates that sellers pushed prices down during the session, but buyers regained control by the close, often signaling a bullish reversal after a downtrend. Traders typically wait for confirmation in the following candles before taking action.
12. Shaven Head
The Shaven Head candlestick has a solid body with little to no upper shadow, meaning the price closed near the session’s high. This pattern often indicates strong bullish momentum, as buyers consistently pushed prices upward throughout the period. Traders view it as a sign of confidence in an ongoing uptrend, especially when it appears after a pullback.
13. Shaven Bottom
The Shaven Bottom candlestick features a solid body with little to no lower shadow, showing that the price closed near the session’s low. This pattern signals strong selling pressure, as bears dominated the trading period. Traders often interpret it as a bearish continuation signal, especially when it follows a downtrend or appears at resistance levels.
14. High Wave Candle
The High Wave Candle is characterized by a small real body with very long upper and lower shadows, indicating significant price volatility within the trading period. This pattern reflects market indecision, as both buyers and sellers pushed prices sharply in both directions but closed near the opening price. Traders often see this as a warning sign of potential trend reversal or consolidation ahead.
15. Belt Hold (Bullish)
The Bullish Belt Hold is a strong single candlestick pattern that opens near the low and closes near the high of the session, creating a long bullish body with little or no lower shadow. This pattern indicates that buyers took control early and maintained strength throughout the period, often signaling the start of an upward reversal after a downtrend. Traders watch for this pattern as a confident sign of increasing buying momentum.
16. Belt Hold (Bearish)
The Bearish Belt Hold candlestick opens near the high and closes near the low of the session, forming a long bearish body with little or no upper shadow. This pattern shows that sellers dominated the trading period from the start, pushing prices down strongly. It often appears after an uptrend and signals a potential reversal or the beginning of downward momentum, making it a warning for traders to consider bearish positions.
17. Rickshaw Man
The Rickshaw Man is a single candlestick pattern characterized by a small real body centered between long upper and lower shadows. This pattern reflects significant indecision in the market, as both buyers and sellers pushed prices up and down, but neither side could gain control by the close. It often signals a possible trend reversal or a pause in the current trend, so traders watch for confirmation before making decisions.
18. Four Price Doji
The Four Price Doji is a rare candlestick pattern where the open, high, low, and close prices are all exactly the same, resulting in a single horizontal line with no body or shadows. This indicates extreme market indecision and a complete balance between buyers and sellers during the trading period. While uncommon, it signals a potential pause or consolidation phase and traders typically wait for a breakout to confirm the next price direction.
19. Closing Marubozu
The Closing Marubozu is a powerful single candlestick pattern where the candle has a long real body with no upper shadow, but may have a lower shadow. This means the price opened and moved strongly in one direction, closing near the high (for bullish) or low (for bearish). It signals strong buying or selling momentum and often indicates the continuation of the current trend, making it a valuable tool for traders to spot decisive market moves.
20. Opening Marubozu
The Opening Marubozu is a candlestick with a long real body and no lower shadow, while it may have an upper shadow. This pattern shows that the price opened at the high (for bearish) or low (for bullish) and then moved strongly in the opposite direction during the session. It signals a strong shift in market sentiment right from the start, indicating that buyers or sellers controlled the market early, which can suggest the beginning of a new trend or a strong continuation of the current one.
Double Candlestick Patterns
21. Bullish Engulfing
The Bullish Engulfing is a strong reversal signal appearing after a downtrend. It forms when a green candle completely covers the prior red candle’s body. This shift shows growing buying strength and hints at a possible price rise.
22. Bearish Engulfing
The Bearish Engulfing is a key reversal pattern that appears after an uptrend. It forms when a large red candle completely engulfs the previous smaller green candle. This signals a shift from buying to selling pressure and may indicate the start of a downward move.
23. Piercing Line
The Piercing Line is a bullish reversal pattern that appears after a downtrend. It forms when a red candle is followed by a green candle that opens lower but closes more than halfway into the body of the previous red candle. This indicates strong buying pressure and a potential shift from bearish to bullish sentiment.
24. Dark Cloud Cover
The Dark Cloud Cover is a bearish reversal candlestick pattern that occurs after an uptrend. It forms when a green (bullish) candle is followed by a red (bearish) candle that opens above the previous high but closes below the midpoint of the green candle. This signals a potential shift in market sentiment from bullish to bearish, alerting traders to a possible downtrend.
25. Tweezer Bottom
The Tweezer Bottom is a bullish reversal candlestick pattern that typically appears after a downtrend. It consists of two candles with similar lows, where the first is bearish and the second is bullish. This pattern suggests that sellers failed to push the price lower on the second attempt, indicating strong buying interest and a potential trend reversal to the upside.
26. Tweezer Top
The Tweezer Top is a bearish reversal candlestick pattern that appears after an uptrend. It features two candles with matching highs—typically the first is bullish and the second is bearish. This pattern signals that buyers failed to push the price higher on the second attempt, suggesting a potential shift in momentum from buyers to sellers.
27. Harami (Bullish)
The Bullish Harami is a two-candle pattern that signals a possible trend reversal from bearish to bullish. It forms when a small green candle appears inside the body of a preceding large red candle. This suggests that selling pressure is weakening, and buyers may be stepping in, making it a key indicator for traders watching for bullish turnarounds.
28. Harami (Bearish)
The Bearish Harami is a two-candle pattern that signals a potential reversal to the downside. It starts with a large bullish candle followed by a smaller bearish candle that fits entirely within the body of the first. This suggests that buying momentum is weakening, and sellers may be preparing to take control. It’s more reliable when it appears after a strong uptrend.
29. Harami Cross
The Harami Cross is a two-candle reversal pattern where a long candle is followed by a doji that falls entirely within the first candle’s body. This signals market indecision and a potential trend reversal, especially after a strong prior move. It’s considered more powerful than the standard Harami due to the doji’s clear sign of hesitation.
30. Matching Low
The Matching Low pattern forms when two consecutive candles in a downtrend close at nearly the same price. This repetition at a support level suggests that selling pressure may be weakening, hinting at a potential bullish reversal. Traders view it as an early signal to watch for upward movement.
31. Matching High
The Matching High occurs during an uptrend when two consecutive candles close at nearly the same high price. This pattern indicates strong resistance at that level, hinting that bullish momentum might be fading. It’s often viewed as a potential bearish reversal signal.
32. Counterattack Lines (Bullish)
This pattern appears during a downtrend when a bearish candle is followed by a bullish candle that opens lower but closes at or near the previous day’s close. It suggests buyers are countering the selling pressure, often signaling a potential reversal or at least a temporary pause in the downtrend.
33. Counterattack Lines (Bearish)
This pattern occurs in an uptrend when a strong bullish candle is immediately followed by a bearish candle that opens higher but closes near the previous day’s close. It reflects a sharp reaction from sellers, potentially signaling the beginning of a downward reversal or a pause in the bullish momentum.
34. One White Soldier
The One White Soldier pattern appears during a downtrend and consists of a strong bullish candle that opens within the previous bearish candle’s body and closes above it. This signals a shift in momentum, with buyers stepping in firmly and potentially marking the start of a bullish reversal. It reflects growing trader confidence and a likely pause or reversal in the ongoing downtrend.
35. One Black Crow
The One Black Crow pattern signals a potential bearish reversal after an uptrend. It features a single long bearish candle that opens within the previous candle’s body and closes significantly lower. This suggests a sudden shift in sentiment, with sellers gaining control and possibly initiating a downward move in price.
36. Kicking (Bullish)
The Bullish Kicking pattern is a powerful two-candle reversal signal, typically forming after a downtrend. It begins with a long bearish Marubozu followed by a gap-up bullish Marubozu, with no overlap between the candles. This strong shift in sentiment signals aggressive buying pressure and often marks the start of a new uptrend.
37. Kicking (Bearish)
The Bearish Kicking pattern is a strong reversal signal that occurs after an uptrend. It features a bullish Marubozu followed by a gap-down bearish Marubozu, with no overlap between the candles. This sudden shift from bullish to bearish sentiment suggests strong selling pressure and a potential beginning of a downward trend.
38. Thrusting Line
The Thrusting Line is a bearish continuation pattern that appears during a downtrend. It features a long bearish candle followed by a bullish candle that opens lower but closes near the midpoint of the previous candle. While it may hint at some buying pressure, the failure to close above the prior candle’s midpoint often signals that bears remain in control.
39. Inside Bar
The Inside Bar pattern occurs when a candle forms completely within the high and low range of the previous candle. It signals market indecision or consolidation and often precedes a breakout. Traders watch this setup closely for potential trend continuation or reversal depending on the breakout direction.
40. Outside Bar
The Outside Bar forms when the current candle’s high is higher and the low is lower than the previous candle, engulfing it completely. This signals strong volatility and can suggest a potential trend reversal or continuation, depending on market context and the breakout direction.
Triple Candlestick Patterns
41. Morning Star
The Morning Star is a bullish reversal pattern that appears after a downtrend. It consists of three candles: a large bearish candle, a small-bodied candle indicating indecision, and a strong bullish candle that closes near or above the midpoint of the first candle. This formation signals a shift in momentum from sellers to buyers.
42. Evening Star
The Evening Star is a bearish reversal pattern that appears at the top of an uptrend. It consists of three candles: a strong bullish candle, a small-bodied candle indicating hesitation, and a bearish candle that closes well into the first candle’s body. This pattern signals weakening buyer momentum and a potential shift toward selling pressure.
43. Three White Soldiers
This bullish reversal pattern appears after a downtrend and consists of three consecutive long-bodied green candles. Each candle opens within the previous one’s body and closes near its high, signaling strong buying pressure and a potential shift in trend direction. Traders view this as a powerful indicator of sustained bullish momentum.
44. Three Black Crows
This bearish reversal pattern forms after an uptrend and features three consecutive long red candles, each opening within the previous candle’s body and closing lower. It signals growing bearish pressure and a potential shift from bullish momentum to a downtrend. Traders often interpret this pattern as a sign to prepare for further declines.
45. Three Inside Up
This bullish reversal pattern begins with a large bearish candle, followed by a smaller bullish candle that forms within the first. The third candle is a strong bullish one that closes above the high of the first candle. It signals a potential shift from a downtrend to an uptrend, suggesting growing buyer strength.
46. Three Inside Down
This bearish reversal pattern starts with a large bullish candle, followed by a smaller bearish candle that forms within the first. The third candle is a strong bearish one that closes below the low of the first candle, confirming a potential shift from an uptrend to a downtrend.
47. Three Outside Up
This bullish reversal pattern begins with a bearish candle, followed by a strong bullish candle that completely engulfs it. The third candle continues upward, confirming a potential trend reversal and suggesting growing buying pressure.
48. Three Outside Down
This bearish reversal pattern starts with a small bullish candle, followed by a large bearish candle that fully engulfs it. The third candle continues downward, confirming selling pressure and signaling a potential shift to a downtrend.
49. Rising Three Methods
This bullish continuation pattern begins with a strong upward candle, followed by three or more small bearish candles that stay within the range of the first. It ends with another strong bullish candle, confirming that the uptrend is likely to resume.
50. Falling Three Methods
This bearish continuation pattern starts with a strong downward candle, followed by a series of small bullish candles that stay within the range of the first. It concludes with another strong bearish candle, signaling that the downtrend is likely to continue.
51. Abandoned Baby (Bullish)
This rare but strong reversal pattern appears at the end of a downtrend. It starts with a long bearish candle, followed by a doji that gaps below it, and then a bullish candle that gaps up. The gaps on both sides of the doji indicate a sharp shift in market sentiment from sellers to buyers, signaling a potential trend reversal.
52. Abandoned Baby (Bearish)
This rare reversal pattern signals a strong shift from bullish to bearish sentiment. It begins with a large bullish candle, followed by a doji that gaps above it, and ends with a bearish candle that gaps down. The clear separation around the doji shows market hesitation and a potential start of a downward trend, making it a warning sign for buyers.
53. Side-by-Side White Lines
This pattern features two or more consecutive bullish candles that open at or near the same level and move upward with similar size and direction. Found during an uptrend or a gap-up scenario, it signals continued bullish momentum. The consistency of opening levels and rising closes reflects strong buyer confidence, suggesting the trend is likely to continue.
54. Stick Sandwich
The Stick Sandwich is a bullish reversal pattern formed by three candlesticks. It begins with a bullish candle, followed by a bearish candle, and ends with another bullish candle—both bullish candles closing at or near the same level. This matching close creates a “sandwich” around the bearish candle. Found typically in a downtrend, the pattern indicates strong support at the closing price level. The inability of bears to push the price lower on the second bullish attempt signals potential exhaustion of selling pressure and hints at a reversal to the upside.
55. Concealing Baby Swallow
This rare bullish reversal pattern appears in a downtrend and consists of four consecutive bearish candles. The first two are strong black candles, followed by a small bearish candle that gets completely engulfed by the fourth long black candle. Despite all candles being bearish, the pattern hints at weakening selling pressure and signals a potential bullish reversal if confirmed by a following up move.
56. Ladder Bottom
This bullish reversal pattern appears in a downtrend with five candles. The first three are long bearish candles, the fourth shows weakening momentum, and the fifth is a strong bullish candle that closes above the previous high, signaling a possible trend reversal.
57. Ladder Top
The Ladder Top is a bearish reversal pattern seen in an uptrend. It consists of five candles: the first three are strong bullish candles, the fourth shows slowing momentum, and the fifth is a bearish candle that closes below the previous low, signaling a potential trend reversal to the downside.
Complex / Rare Candlestick Patterns
58. Separating Lines (Bullish)
This bullish continuation pattern appears during an uptrend. It consists of a bearish candle followed by a bullish candle that opens at the same level as the previous open and closes higher. The pattern shows that the brief selling pressure was overcome quickly, reaffirming the strength of the ongoing uptrend.
59. Separating Lines (Bearish)
This bearish continuation pattern occurs during a downtrend. It features a bullish candle followed by a bearish candle that opens at the same level as the previous open and closes lower. The pattern indicates that buying pressure was short-lived and the downtrend is likely to continue.
60. Deliberation
The Deliberation pattern is a bearish reversal signal that appears in an uptrend. It consists of three consecutive bullish candles. The first two have strong bodies, while the third is smaller and shows hesitation, often with a long upper shadow. This pattern suggests that buying momentum is weakening, and a potential reversal or pause in the uptrend may follow.
61. Advance Block
The Advance Block is a bearish reversal pattern that appears during an uptrend. It consists of three consecutive bullish candles with progressively smaller bodies and longer upper shadows. This shows that buying momentum is weakening despite higher prices, signaling a potential upcoming reversal or slowdown in the upward trend.
62. Stalled Pattern
The Stalled Pattern is a bearish reversal signal found in an uptrend. It features three consecutive bullish candles with small real bodies and long upper shadows, indicating that buyers are losing strength. This hesitation suggests the uptrend may be running out of momentum and a reversal could be near.
63. Tri-Star (Bullish)
The Bullish Tri-Star is a rare reversal pattern that appears at the end of a downtrend. It consists of three consecutive doji candles, signaling indecision and weakening selling pressure. This pattern suggests a strong potential for a bullish reversal as the market shifts from sellers to buyers.
64. Tri-Star (Bearish)
The Bearish Tri-Star is a rare reversal pattern that forms at the top of an uptrend. It consists of three consecutive doji candles, indicating market indecision and fading buying pressure. This pattern signals a likely shift from bullish to bearish momentum, suggesting a potential downward reversal.
65. Upside Tasuki Gap
The Upside Tasuki Gap is a bullish continuation pattern that appears during an uptrend. It starts with a strong bullish candle followed by a gap-up and another bullish candle. The third candle is bearish and partially fills the gap but fails to close it completely. This shows that buyers remain in control, and the upward trend is likely to continue.
66. Downside Tasuki Gap
The Downside Tasuki Gap is a bearish continuation pattern occurring during a downtrend. It begins with a strong bearish candle followed by a gap down and another bearish candle. The third candle is bullish and partially fills the gap but doesn’t close it entirely, indicating that sellers still dominate and the downward trend is likely to persist.
67. Upside Gap Two Crows
The Upside Gap Two Crows is a bearish reversal pattern that forms after an uptrend. It starts with a strong bullish candle, followed by a bearish candle that gaps up above the first candle’s close but closes within its body. The third candle is bearish and closes below the second candle, confirming the potential reversal. This pattern signals weakening buying pressure and a likely shift to a downtrend.
68. Mat Hold Pattern
The Mat Hold is a bullish continuation pattern that appears during an uptrend. It starts with a strong bullish candle, followed by a few small bearish or neutral candles that show a brief pause or consolidation. The pattern finishes with a strong bullish candle that breaks above the earlier candles, signaling the resumption of the upward trend.
69. Homing Pigeon
The Homing Pigeon is a bullish reversal pattern found at the end of a downtrend. It consists of two consecutive bearish candles, where the second candle is smaller and completely engulfed within the body of the first. This suggests that selling pressure is weakening and buyers may soon take control, signaling a potential upward reversal.
70. Meeting Lines
Meeting Lines is a reversal pattern that appears at the end of a trend. It consists of two candles: one with a strong body in the direction of the current trend, followed by a candle that opens lower (in an uptrend) or higher (in a downtrend) but closes at nearly the same price as the first candle’s close. This pattern signals indecision and a possible reversal or pause in the trend.
71. On Neck Line
The On Neck Line is a bearish continuation pattern seen during a downtrend. It features a strong bearish candle followed by a smaller bullish candle that closes near the low of the first candle, just above its closing price. This pattern shows a brief pause in selling pressure but suggests that the downtrend is likely to continue.
72. In Neck Line
The In Neck Line is a bearish continuation pattern appearing during a downtrend. It consists of a long bearish candle followed by a smaller bullish candle that closes just slightly above the low of the first candle, but still near its close. This pattern indicates a brief pause in selling before the downtrend is expected to continue.
73. Thrusting Line
The Thrusting Line is a bearish continuation pattern seen in a downtrend. It starts with a long bearish candle followed by a bullish candle that opens below the previous close but closes within the body of the first candle, without fully recovering it. This shows a temporary buying effort that fails to reverse the trend, signaling that sellers remain in control.
74. Tower Bottom
The Tower Bottom is a bullish reversal pattern that appears after a downtrend. It features a sharp decline followed by a period of consolidation with small candles, and then a strong bullish candle signaling a potential trend reversal. This pattern suggests that selling pressure has exhausted and buyers are stepping in.
75. Tower Top
The Tower Top is a bearish reversal pattern that forms after an uptrend. It starts with a strong upward move, followed by a period of consolidation with small-bodied candles, and ends with a sharp decline marked by a long bearish candle. This pattern signals that buying momentum is fading and a downtrend may begin.
76. Doji Star (Bullish)
The Bullish Doji Star is a reversal pattern that appears at the end of a downtrend. It consists of a long bearish candle followed by a doji that gaps below the previous close, indicating market indecision. This pattern signals that selling pressure is weakening and a bullish reversal may be underway.
77. Doji Star (Bearish)
The Bearish Doji Star is a reversal pattern that appears at the end of an uptrend. It consists of a long bullish candle followed by a doji that gaps above the previous close, signaling indecision and weakening buying pressure. This pattern suggests a potential bearish reversal ahead.
78. Breakaway (Bullish)
The Bullish Breakaway pattern signals a significant reversal after a sustained downtrend. It begins with multiple bearish candles, followed by a strong bullish candle that gaps up sharply, showing buyers entering aggressively. This gap up breaks the prior trend and suggests the start of a new upward momentum. Traders view this pattern as a reliable sign that the downtrend has exhausted and bulls are gaining control.
79. Breakaway (Bearish)
The Bearish Breakaway forms during an uptrend and marks a potential reversal to the downside. After several bullish candles, a large bearish candle gaps down, signaling sellers are overpowering buyers. This gap breaks the rising trend and hints at increased selling pressure ahead. It warns traders that the bullish momentum may be ending and a downtrend could begin.
80. Falling Window
The Falling Window represents a gap down between two candles during a downward trend. This gap emphasizes strong selling pressure, as the price opens significantly lower than the previous close. It is considered a bearish continuation signal, suggesting that sellers remain in control. Traders interpret this as confirmation that the downward momentum is strong and likely to persist.
81. Rising Window
The Rising Window is a gap up within an uptrend, where the current candle opens above the previous candle’s high. This gap reflects intense buying interest and growing bullish sentiment. It confirms that buyers are confident and pushing prices higher. Market participants often see this as a signal for trend continuation and a good entry point for longs.
82. Gap Side-by-Side White Lines
This pattern features two or more bullish candles opening at or near the same price level after a gap up. The candles rise with similar size and shape, demonstrating consistent buying strength. It highlights the steady confidence of bulls in maintaining upward momentum. Such uniformity suggests the uptrend is strong and likely to continue without major pullbacks.
83. Bearish Counterattack
The Bearish Counterattack forms when a bearish candle follows a bullish candle but closes near the previous candle’s close. This indicates sellers have entered aggressively, pushing prices back toward where buyers had dominated. The pattern signals a potential loss of bullish control and warns of a possible trend reversal. Traders watch for follow-up bearish action to confirm the shift.
84. Bullish Counterattack
The Bullish Counterattack occurs when a bearish candle is followed by a bullish candle that opens higher but closes near the previous close. This pattern shows buyers stepping in to challenge prior selling pressure. It indicates a tug of war between bulls and bears, with bulls regaining strength. Confirmation of upward momentum often leads traders to expect a bullish reversal.
85.Inverted Hammer Confirmation
An Inverted Hammer forms during a downtrend and signals potential reversal when confirmed by a strong bullish candle afterward. The pattern shows buyers attempting to push prices higher, despite early selling pressure. Confirmation strengthens the signal that bulls are gaining control and the downtrend may be ending. Traders consider this a good entry point if the confirmation candle closes well above.
86. Hanging Man Confirmation
The Hanging Man appears in an uptrend as a warning of a potential reversal. It has a small body with a long lower shadow, indicating that sellers tested the market but buyers kept prices up. Confirmation comes with a bearish candle following, signaling increased selling pressure. Traders often take this as a cue to tighten stops or consider profit-taking.
87. Bearish Belt Hold Confirmation
The Bearish Belt Hold pattern features a long bearish candle that opens near its high after an uptrend. This strong downward move signals sellers are gaining dominance. If confirmed by further bearish action, it suggests that the prior upward trend may be reversing. Traders view this as an early warning to reduce long positions or prepare for a short setup.
88. Bullish Belt Hold Confirmation
A Bullish Belt Hold begins with a long bullish candle opening near its low after a downtrend. This demonstrates renewed buying interest and a rejection of lower prices. Confirmation by continued upward movement reinforces the idea that bulls are taking control. It is often seen as a reliable signal of trend reversal to the upside.
89. High Wave Confirmation
The High Wave candle has long upper and lower shadows with a small body, reflecting significant market indecision. Buyers and sellers battle intensely but neither gains clear control. Confirmation requires a strong candle afterward that breaks the stalemate, providing direction. This pattern warns traders to watch for a decisive move soon.
90. Doji Confirmation
A Doji candle has a tiny body, showing indecision and balance between buyers and sellers. It indicates uncertainty about the next price direction. Confirmation comes when the following candle moves strongly up or down, revealing which side has gained control. Traders often wait for this confirmation before taking new positions.
91. Engulfing Confirmation
The Engulfing pattern occurs when a larger candle fully covers the previous candle’s real body. It signals a powerful shift in momentum as one side overwhelms the other. Confirmation by continued movement in the engulfing candle’s direction strengthens the signal. This pattern is widely used to identify strong trend reversals or continuations.
92. Star Confirmation
A Star is a small-bodied candle that appears after a strong trend, suggesting hesitation or a pause. It often precedes a reversal or temporary consolidation. Confirmation happens when the next candle follows through in the anticipated direction. Traders use the star and its confirmation to time entries and exits.
93. Pattern Gap Up
A Pattern Gap Up occurs when the price gaps higher within a recognizable chart formation. This gap highlights strong buying pressure and bullish sentiment. It often signals the continuation of the uptrend with increased momentum. Traders view it as an opportunity to join the trend early.
94. Pattern Gap Down
This pattern shows a gap down within a chart pattern, reflecting strong selling pressure. It suggests the downtrend is resuming or accelerating. The gap acts as a barrier and confirms bearish sentiment. Traders consider this a sign to hold or initiate short positions.
95. Long Line Candle
A Long Line candle has a large body and represents decisive buying or selling pressure. The strong momentum during this candle’s formation can signal the start or continuation of a trend. Traders often use it to identify entry points or confirm trend strength.
96. Short Line Candle
The Short Line candle has a small real body, indicating a period of market hesitation or equilibrium. It suggests neither buyers nor sellers have the upper hand. Traders interpret it as a pause before a potential breakout or reversal.
97. Gap with Doji
This pattern combines a price gap followed by a Doji candle, highlighting indecision after a strong move. It signals that market participants are uncertain about the next direction. Traders watch closely for the next candle to confirm a breakout or reversal.
98. Doji Sandwich
The Doji Sandwich places a Doji candle between two candles of opposing directions. This pattern reflects heightened uncertainty and conflicting sentiment. It often precedes a significant reversal, prompting traders to exercise caution.
99. Tweezer Confirmation
The Tweezer pattern features two candles with matching highs or lows, signaling a potential reversal point. Confirmation occurs when a strong candle follows in the opposite direction, validating the shift. Traders use this to anticipate changes in trend direction.
100. Harami Cross Confirmation
The Harami Cross consists of a large candle followed by a Doji contained within its range. It represents a pause in momentum and potential reversal. Confirmation by the next candle moving against the prior trend strengthens the reversal signal.
101. Line Strikes (Bullish)
The Bullish Line Strike has a small bearish candle followed by a large bullish candle that “strikes” through the previous candle’s range. This shows buyers overwhelming sellers and regaining control. It often signals the resumption of an uptrend.
102. Line Strikes (Bearish)
The Bearish Line Strike features a small bullish candle followed by a strong bearish candle that breaks the previous candle’s body. This indicates sellers pushing prices lower aggressively. It warns of renewed downward momentum.
103. Side-by-Side Black Lines
This pattern shows two or more consecutive bearish candles opening at nearly the same price level. The steady and consistent selling pressure suggests a strong downtrend. Traders view this as a signal that bears remain firmly in control.
104. Scissor Pattern
The Scissor Pattern forms when two candles’ ranges diverge sharply, resembling the opening of scissors. It indicates increasing volatility and a possible shift in trend direction. Traders often prepare for a reversal or breakout following this pattern.
105. Island Reversal (Bullish)
A Bullish Island Reversal occurs when a gap down is followed by a period of consolidation and then a gap up, isolating a price “island.” This rare pattern signals a strong reversal from bearish to bullish momentum. It often marks the start of a sustained upward move.
106. Island Reversal (Bearish)
The Bearish Island Reversal forms when a gap up is followed by consolidation and then a gap down, creating a price “island” separated from prior action. This pattern signals a shift from bullish to bearish sentiment. It often marks the beginning of a significant downtrend.
Upcoming Next…….!
These patterns are best used in conjunction with volume analysis, support and resistance levels, and other indicators for better accuracy. Mastering these candlestick formations helps traders anticipate reversals and continuations with greater confidence.
“Patterns tell stories—learn their language and you’ll read the market like a seasoned trader.”
Bonus: How to Practice Candlestick Reading
Tips for Beginners:
- Use demo accounts on platforms like TradingView
- Look for patterns on major stocks or indices (e.g., S&P 500, Nifty 50)
- Combine candlestick reading with volume and trendlines
- Keep a trading journal to track pattern reliability
Must-Avoid Mistakes:
- Don’t trade based on one candle alone
- Avoid ignoring broader market context
- Don’t neglect stop-loss placement
Learn the Language of the Markets
Candlestick patterns are more than just chart shapes—they’re a visual representation of emotion, psychology, and momentum in the market. By learning these patterns, you’re not just trading charts; you’re understanding the market’s heartbeat.
Stay tuned for our upcoming posts where we break down each pattern with examples, market context, and real case studies.
Happy Trading!